
In my role as a hockey bettor and analyst, I use predictive models and processes to identify advantages in betting markets. This article will demonstrate how you can utilize the R programming language to simulate the winner of a best-of-7 playoff series by leveraging the sports betting market to estimate the probability that a team will win a particular game.
Methodology and Process
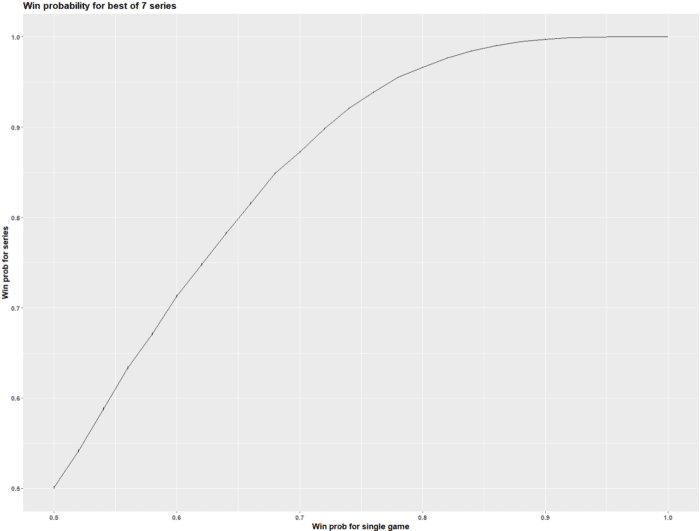
There are different ways to determine the winner of a best-of-7 series. For example, this method plots the relationship between a team’s single-game win probability and their probability of winning the series as shown in the graphic below.
However, win probabilities change from game to game due to home-ice advantage and other factors in real life, which makes it tricky to pinpoint how often a team will win a series based on the probability that they will win a single game. Not to mention, there are 35 different ways a team can win a series. For example, in a series between Team A and Team B, here are the 35 different ways that Team A can win a best-of-7 series:
HHHH
HVHHH
HHVHH
HHHVH
VHHHH
HHHVVH
HHVVHH
HVVHHH
VVHHHH
HVHVHH
HHVHVH
VHVHHH
HVHHVH
VHHVHH
VHHHVH
VVVVHHHH
VVHVHHHH
VVHHVHHH
VVHHHVHH
VVHHHHVH
VHVHVHHH
VHVHHVHH
VHVHHHVH
VHVHHHHV
VHHVVHHH
VHHVHVHH
VHHVHHVH
VHHHVHVH
VHHHVHHV
VHHHHVVH
HHVVVHHH
HHVHVHVH
HHVHVHHV
HHVHHVVH
HHHVVVHH
HHHVHVHV
HHHVHVHH
HHHVHHVV
HHHHVVVH
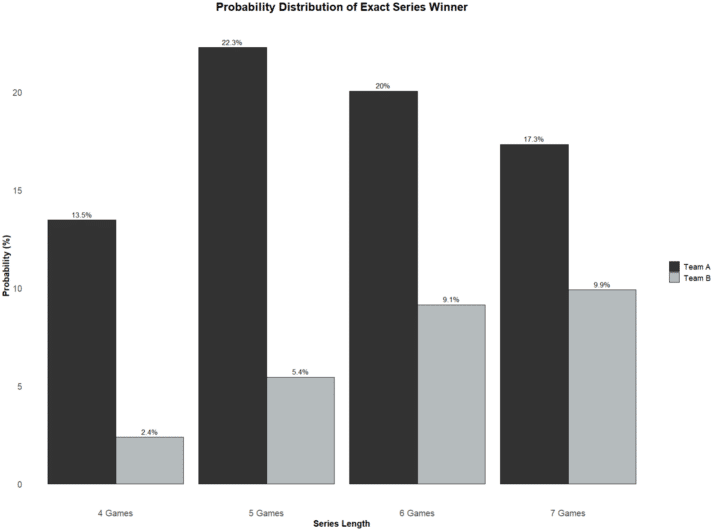
By simulating the best-of-7 series many times over, you can estimate the likelihood of each scenario (e.g. HHHH, HVHHH, HHVVHVH, etc.) and count how many times a team wins in exactly four, five, six, or seven games as shown in the graphic below.
Betting odds in leagues like the NBA, MLB, and, the NHL represent the underlying probabilities of the games. So, if we convert the odds into probabilities, the percentages can be used as predictions for home and away games in the simulation.
Convert Sports Betting Odds to Probabilities
For this experiment, we’re going to use NHL odds from the 2022-23 season to predict the winner of a first-round playoff series between the Los Angeles Kings and Edmonton Oilers. This is an ideal spot to apply this forecasting technique because their final two regular-season meetings happened just weeks before they met in the playoffs, and the game odds can act as reference points for home and away probabilities in a best-of-7 series.
For example, on March 30th, a little over two weeks before these two teams met in the playoffs, the Los Angeles Kings were a +163 underdog when they travelled to Edmonton to play the Oilers, who were a -190 favourite. Then on April 4th, fewer than two weeks before the playoffs, the Oilers were a -150 favourite when they traveled to Los Angeles to play the Kings, who were listed as a +130 underdog.
Let’s convert the game odds into probabilities and remove the vigorish so we can use them as game predictions in our simulation.
Using Canada Sports Betting’s free sports betting calculator, I converted the odds for both teams’ home and away odds to implied probability. In the first game, Edmonton’s implied win probability was 65.52 percent, compared to 38.02 percent for Los Angeles. If we add 0.6552 and 0.3802 together, we get 1.0354. This is because sportsbooks make money by offering odds that do not fairly represent the probability of the event. Sports bettors call this vigorish or juice, and to get to the underlying probabilities, we must remove the extra 0.0354 from the equation. This is done by dividing each team’s implied probability by 1.0354.
The result is 0.6328 for the Oilers and 0.3672 for the Kings, which equals 100 percent. I repeated this process for the second game and ended up with 0.5798 for the Oilers and 0.4202 for the Kings. Therefore, based on the odds, the betting market is suggesting that Edmonton has a 63.28% chance of winning at home and a 57.98% chance of winning on the road. Now we’ve got something that we can use to simulate a best-of-7 playoff series between these two teams.
Best-of-7 Series Format
Each series in the Stanley Cup Playoffs is played in a 2–2–1–1–1 format, which means the team with the better record plays Games 1, 2, 5 and 7 at its home arena, while its opponent hosts Games 3, 4, and 6. Only the first four games in the series are guaranteed, with Games 5, 6 and 7 played if necessary.
In this example, the first two games will be played in Edmonton, where the Oilers have a 63.28% chance of winning. That’s big because Edmonton’s chances of winning drop to 57.98% for games three and four, as they will be played in Los Angeles. If need be, the teams will alternate venues for games five, six, and seven. In other words, to find out how often Edmonton will win the series we will use the following game probabilities (0.6328, 0.6328, 0.5798, 0.5798, 0.6328, 0.5798, 0.6328) to start with.
How To Simulate A Best-Of-7 Series 100,000 Times
You can predict the winner of a best-of-7 by using Microsoft Excel to run a Monte Carlo simulation, but it’s easier to do with the following code in R, a programming language used for statistical computing and graphics. Both R and RStudio, a software application that makes R easier to use, are free and easy to download, but for this exercise, we can run R code below online here.
# Set seed for reproducibility
set.seed(123)
# Define the probabilities for Home Team winning each game
probabilities <- c(0.6328, 0.6328, 0.5798, 0.5798, 0.6328, 0.5798, 0.6328)
# Number of simulations
num_simulations <- 100000
# Function to simulate a single playoff series and return the winner and number of games played
simulate_series <- function(probabilities) {
num_games_played <- 0
team_a_wins <- 0
team_b_wins <- 0
while (team_a_wins < 4 && team_b_wins < 4) {
result <- sample(c(“A”, “B”), 1, prob = c(probabilities[num_games_played + 1], 1 – probabilities[num_games_played + 1]))
if (result == “A”) {
team_a_wins <- team_a_wins + 1
} else {
team_b_wins <- team_b_wins + 1
}
num_games_played <- num_games_played + 1
}
winner <- ifelse(team_a_wins == 4, “A”, “B”)
return(c(winner, num_games_played))
}
# Run the Monte Carlo simulation
results <- t(replicate(num_simulations, simulate_series(probabilities)))
# Extract winners and number of games played
winners <- results[, 1]
num_games_played <- as.integer(results[, 2])
# Create a data frame for results
results_df <- data.frame(
Metric = c(
“Team A wins series”,
“Team A wins in 4 games”,
“Team A wins in 5 games”,
“Team A wins in 6 games”,
“Team A wins in 7 games”,
“Team B wins series”,
“Team B wins in 4 games”,
“Team B wins in 5 games”,
“Team B wins in 6 games”,
“Team B wins in 7 games”
),
Result = c(
sum(winners == “A”) / num_simulations * 100,
sum(winners == “A” & num_games_played == 4) / num_simulations * 100,
sum(winners == “A” & num_games_played == 5) / num_simulations * 100,
sum(winners == “A” & num_games_played == 6) / num_simulations * 100,
sum(winners == “A” & num_games_played == 7) / num_simulations * 100,
sum(winners == “B”) / num_simulations * 100,
sum(winners == “B” & num_games_played == 4) / num_simulations * 100,
sum(winners == “B” & num_games_played == 5) / num_simulations * 100,
sum(winners == “B” & num_games_played == 6) / num_simulations * 100,
sum(winners == “B” & num_games_played == 7) / num_simulations * 100
)
)
# Print the results dataframe
cat(“[1] ‘Series Probabilities:’\n”)
print(results_df)
The code simulates the series 100,000 times and found that the Oilers won the series approximately 73 percent of the time. Additionally, it also calculated the exact series winner, which can be used to calculate the exact series length and/or series spreads for odds comparison. Here are the results:
Team A wins series 72.960
Team A wins in 4 games 13.608
Team A wins in 5 games 22.098
Team A wins in 6 games 19.971
Team A wins in 7 games 17.283
Team B wins series 27.040
Team B wins in 4 games 2.305
Team B wins in 5 games 5.360
Team B wins in 6 games 9.286
Team B wins in 7 games 10.089
Sportsbooks listed the Oilers as a -280 series favourite, while Los Angeles was listed at +240. That’s an implied probability of 73.68 percent for the Oilers, but if we remove the juice, we get a “true” probability of 71.47 percent. So, although we technically made a more accurate prediction than the betting market in this particular example, we did not find value in betting on Edmonton at -280 to win the series because the implied odds were slightly higher than our estimation.
Updating Simulation With New Information
To run a simulation with different parameters, you would simply update the probabilities. For example, to find out the series probability after the Oilers lose Game 1 you simply change the first probability to zero e.g. (0, 0.6328, 0.5798, 0.5798, 0.6328, 0.5798, 0.6328) to simulate the series from its current state, and repeat this process after each game to get an updated series prediction.
Conclusion
This concludes how to simulate a best-of-7 playoff series using the R programming language. Now you can input your own estimates and run the code to predict the winner of any best-of-7 format, like the World Series, NBA Finals, or Stanley Cup Playoffs.